Solve
Guides
0
Question
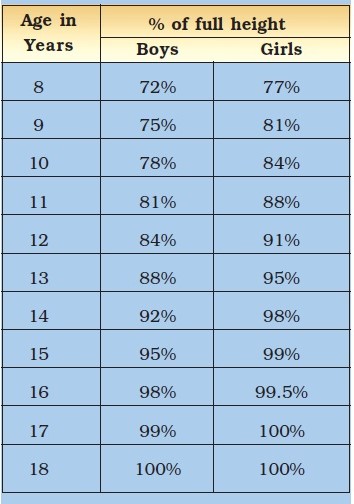
The given double graph shows the average heights of boys and girls at specific ages Which conclusion is supported by the graph?

- Girls are taller than boys until the age of 14
- Girls and boys grow the same amount each year
- After the age of 14 boys grow faster than girls
- Boys are always taller than girls
Open in App
Solution
Verified by Toppr
Till age 10, boys and girls grow the same. From 10 to 12, girls grow faster.
And after the age of 14 boys grow faster than girls.
Was this answer helpful?
1
Similar Questions
Q1
The given double graph shows the average heights of boys and girls at specific ages Which conclusion is supported by the graph?
View Solution
View Solution
Q3
The table below shows the data on approximate heights of boys and girls as they grow in age. Draw graphs showing height and age for both boys and girls on the same graph paper. What conclusions can be drawn from these graphs? [5 MARKS]
View Solution
Q4
The table below shows the data on the likely heights of boys and girls as they grow in age. Graph alongside shows height and age of girls and boys on the same graph paper. Which of these statements can be drawn as a conclusion from the graph?

| Age (Years) | Height (cm) | |
| Boys | Girls | |
| 0 | 53 | 53 |
| 4 | 96 | 92 |
| 8 | 114 | 110 |
| 12 | 129 | 133 |
| 16 | 160 | 150 |
| 20 | 173 | 165 |
View Solution
View Solution