Solve
Guides
0
Question
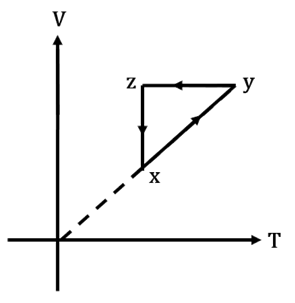
A thermodynamic cycle $$xyzx$$ is shown on a $$V-T$$ diagram.
The $$P-V$$ diagram that best describes this cycle is : (Diagrams are schematic and not to scale)


Open in App
Solution
Verified by Toppr
Correct option is C.
Consider the path $$xy$$, [ref. image 1]
$$V \propto T$$, $$V = KT$$
Also, $$PV = nRT$$
$$\therefore P = \dfrac{nRT}{V} = \dfrac{nRT}{KT} = \dfrac{nR}{K}$$
$$\therefore P$$ is a constant.
$$\therefore$$ path $$xy$$ corresponds to isobaric process.
Consider the path $$yz$$.
Volume is constant.
Consider the path $$zx$$
Temperature is constant. (isothermal process)
or $$PV = $$ constant and $$P = \dfrac{K'}{V}$$
The graph corresponding to path $$zx$$ will be a rectangular hyperbola. [ref. image 2]
Was this answer helpful?
11
Similar Questions
Q1
A thermodynamic cycle $$xyzx$$ is shown on a $$V-T$$ diagram.
The $$P-V$$ diagram that best describes this cycle is : (Diagrams are schematic and not to scale)
The $$P-V$$ diagram that best describes this cycle is : (Diagrams are schematic and not to scale)
View Solution
Q2
A thermodynamic cycle is shown on a diagram .
The diagram that best describes this cycle is : (Diagrams are schematic and not upto scale)
View Solution
Q3
A thermodynamic cycle xyz is shown on a V−T diagram.

The P−V digram that best describe this cycle is : (diagrams are schematic and not to scale)
The P−V digram that best describe this cycle is : (diagrams are schematic and not to scale)
View Solution
Q4
A thermodynamic cycle xyz is shown on a V−T diagram.
The P−V digram that best describe this cycle is : (diagrams are schematic and not to scale)
The P−V digram that best describe this cycle is : (diagrams are schematic and not to scale)
View Solution
View Solution