Linear interpolation is a method useful for curve fitting using linear polynomials. It helps in building new data points within the range of a discrete set of already known data points. Therefore, the Linear interpolation is the simplest method for estimating a channel from the vector of the given channel’s estimates. It is very useful for data prediction, data forecasting, market research, and many other mathematical and scientific applications. This article will elaborate on this concept with Linear Interpolation Formula and suitable examples. Let us learn it!
What is Linear Interpolation?
Interpolation is a method for estimating the value of a function between any two known values. Often some relationship is there, and with the help of experiments at a range of values to predict other values. Interpolation is useful to estimate the function of the un-tabulated points. Interpolation is useful to estimate any desired value at some specific known coordinate point.
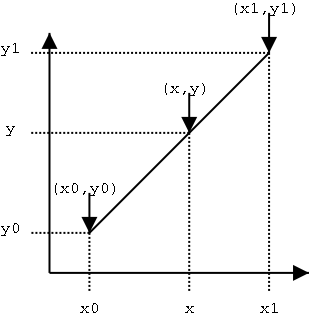
Linear interpolation is useful while searching for a value between given data points. Therefore mathematician considers it as “filling in the gaps” for a given data values in tabular format. The strategy for linear interpolation is to use a straight line to connect the given data points on positive as well as the negative side of the unknown point.
Often, Linear interpolation is not accurate for non-linear data. If the points in the data set to change by a large value, then linear interpolation may not give a good estimate. Also, it involves estimating a new value by connecting two adjacent known values with a straight line.
Formula of Linear Interpolation
Its simplest formula is given below:
\(y=y_{1}+\frac{(x-x_{1})(y_{2}-y_{1})}{x_{2}-x_{1}}\\\)
This formula is using coordinates of two given values to find the best fit curve as a straight line. Then this will give any required value of y at a known value of x.
In this formula, we are having terms as:
- \(x_{1}\) and \(y_{1}\) are the first coordinates
- \(x_{2}\) and \(y_{2}\) are the second coordinates
- x is the point to perform the interpolation
- y is the interpolated value.
Solved Examples for Linear Interpolation Formula
Q.1: Find the value of y at x = 4 given some set of values (2, 4), (6, 7).
Solution: Given the known values are,
\(x = 4\) \(x_{1} = 2\) \(x_{2} = 6\) \( y_{1} = 4\) ; \(y_{2} = 7\)
The interpolation formula is,
\(y=y_{1}+\frac{(x-x_{1})(y_{2}-y_{1})}{x_{2}-x_{1}}\\\)
i.e. \(y = 4 + \frac { (4−2) \times (7−4)}{ (6−2)}\)
y = 112
Q.2: Consider the following table of data:
| Day | Height |
| 1 | 0 |
| 3 | 4 |
| 5 | 8 |
| 7 | 12 |
| 9 | 16 |
Based on this chart, calculate the estimated height of the plant on the fourth day.
Solution: This is an example of linear growth and hence the linear interpolation formula is very much suitable here. We may take (3,4) as the first data point and (5,8) as the second data point.
We have values as:
- \(Y_{1} = 4\)
- \(X_{1} = 3\)
- \(Y_{2} = 8\)
- \(X_{2}= 5\)
Now, applying the formula:
\(y=y_{1}+\frac{(x-x_{1})(y_{2}-y_{1})}{x_{2}-x_{1}}\\\)
Substituting the values we have:
\(y=4 +\frac{(x-3)(8-4)}{5 -3}\\\)
\(y = 4 + 2 (x-3)\\\)
\(y = 2x -2 \\\)
Thus for forth day x = 4.
\(Hence y = 2 \times 4 – 2\)
Y = 6
Therefore, at forth day height will be 6 units.


I get a different answer for first example.
I got Q1 as 20.5
median 23 and
Q3 26