The distance you cover and the time you take to cover that distance are always at the back of your mind while traveling. The faster your vehicle will move the faster you will finish with traveling. Speed, distance and time are closely related to each other. In this part, we shall have a glimpse of the relation between the three and also help you chalk out a Distance Time graph.
Suggested Videos


Measurement of Speed
Speed is a very common word and is used to signify a slow or fast motion of an object. By motion here we mean, change in the position of the object in a certain interval of time. A unit distance covered in a unit interval of time is called speed. Suppose we say the speed of a bus is 45 km/h, we intend to say that the bus has covered a distance of 45 km in one hour.

How do we measure speed for any vehicle? It’s simple, keeping a track of the distance covered and time taken let’s you know the speed. For example: If a car takes 4 hours to cover 80 km then the average speed of the car is 80/4 = 20. The speed here is 20 km/h.
Vehicles have meters in them to measure speed and distance both. The meter that measures speed is called the speedometer while the meter that measures distance is called the odometer. Both these meters are present near the ignition point of every vehicle.

Distance Time graph
Before learning about the distance-time graph let us discuss the types of graphs. Graphs are basically of three types:
- Bar Graph is a graph represented by vertical rectangular blocks. Each block in the graph represents a reading.
- Piechart is a pie like a graph that represents the data on a circular pie-like chart.
- The line graph represents the different findings of the data in the form of lines.

The distance Time graph is a line graph that denotes the distance versus time findings on the graph. Drawing a distance-time graph is simple. For this, we first take a sheet of graph paper and draw two perpendicular lines on it conjoining at O. The horizontal line is the X-axis, while the verticle line is the Y-axis. On these axes, we write the quantities or readings of our observation. Now let’s take a few observations of a traveling car:
| S.no. | Time | Distance |
| 1 | 0 | 0 |
| 2 | 5min | 10km |
| 3 | 10min | 20km |
| 4 | 15min | 30km |
| 5 | 20min | 40km |
Using the above information our graph shall be as follows:
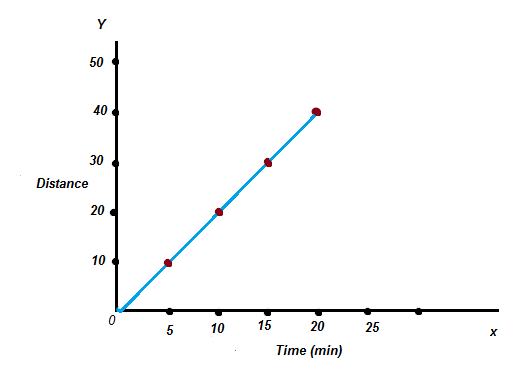
Now when we draw a graph, we take our observations on any axis, here we have taken distance on the x-axis while time on the y-axis. Point O is a zero (o) i.e our point of departure or beginning. Nowhere we notice that the line when joined with our different observations, is a slant line. This shows that the speed during the course of traveling is constant.
Browse more Topics under Motion And Time
Learn more about the Measurement of Time here.
The shape of the Graph
The shapes in the graph can be of any shape depending on the distance to time ratio. Some of the common graphs are:
 In distance graphs shown in the figure above illustrates the speed on vehicles in different conditions. Graph (a) shows that the vehicle is traveling at a uniform speed. Graph(b) signifies that the vehicle is at rest. Graph (c) denotes the non-uniform speed of the vehicle. The shape of the graph depends on the speed of the vehicle or object.
Use of Distance Time graph
A distance-time graph is a plot that represents the distance covered in the given time interval. In other words, it tells us about the speed of the vehicle while traveling a certain distance. As an illustration of the speed of an object, this graph gives a better understanding of the numerical data of distance and time. Apart from helping us compare different sets of data together, a distance-time graph also helps in comparing the speed of different vehicles. This graph also lets us know the distance moved by the vehicle at any instant of time. A distance-time graph is useful in finding the changing speed at different distances.

In the above graphical representation, we can with the help of the observations calculate the speed of the vehicle when it crossed a distance of 2okm. The speed here is 20/10, which is equal to 2m/sec. As a pictorial representation of the speed of a vehicle, the distance-time graph is an easy way of tracking the changing speed of the vehicle. It not only helps us track the various range of speed but also makes it easy to calculate the distance to time ratio at any point in time.
Solved Examples For You
1. Distance-time graph is represented on a :
a. Bar graph b. Line graph c. Piechart d. None of these
Solution: As we already know, we can use a Line graph to plot a Distance Time graph.


Leave a Reply