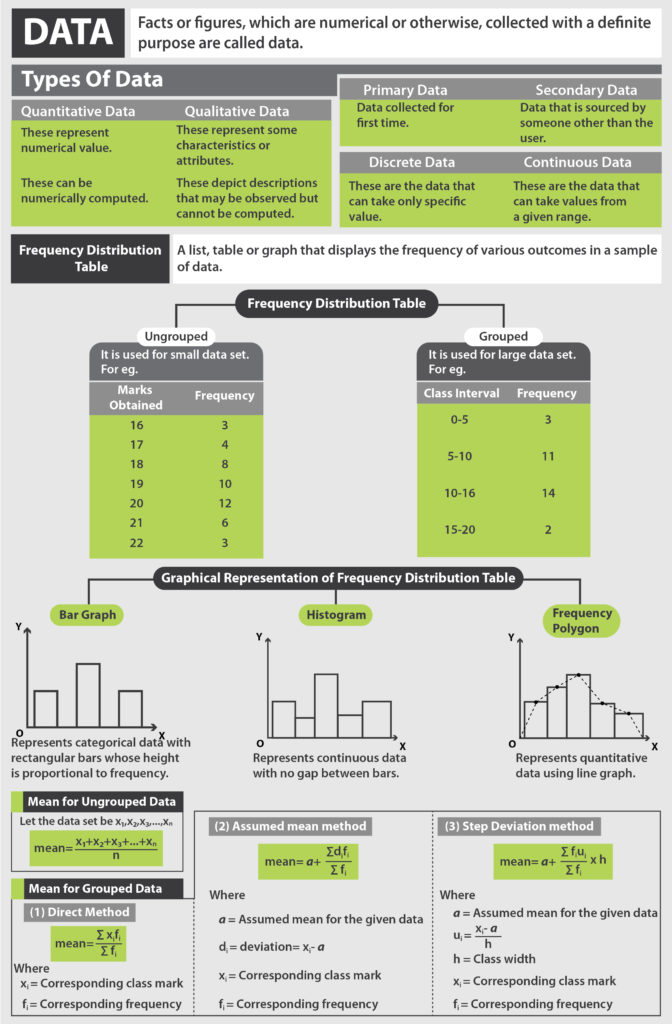
So let’s say for example in a tough exam, you and your friends performed very averagely. However, this one brainiac scored 100%. Now when you calculate the average marks of the class, it’s higher due to his score. But, this is not a fair representation of the reality. Here is where the concept of Median will help you out.
Videos
Median
In simplest terms, Median is the middle most value of a given data set. It is the value that separates the higher half of the data set, from the lower half. It may be said to be the “middle value” of any given population. To calculate the Median the data should be arranged in an ascending or a descending order, the middlemost number from the so arranged data is the Median.
To calculate the Median of an odd number of terms, we arrange the data in an ascending or descending order, and the middlemost term is the Median. And to calculate the Median of an even number of terms, we arrange the data in an ascending or decending order and take an average of the two middle term.
- So if n is an odd number, M = ( \( \frac{n+1}{(2)}\) )th term
- And if n is a even number, M = [ ( \( \frac{n}{2})\) + 1 ) th term + \( \frac{n}{(2)} \) th term ] ÷ 2
Example : So lets find the Median of the following data
6, 2, 7, 9, 4, 1
First let’s arrange in ascending (or descending) order
1, 2, 4, 6, 7, 9
Now as you see its an even number of terms, so we use the formula
M = [ ( \( \frac{n}{2})\) + 1 ) th term + \( \frac{n}{(2)} \) th term ] ÷ 2
M = (4 + 6) ÷ 2 = 5
Download the Cheat Sheet of Statistics by clicking on the button below

Median of Grouped Data
To find the Median of groued data, we cannot just pick the middle value anymore since the data is divided into class intervals. Here we have to follow the given steps,
- Prepare a table with 3 columns.
- In column 1 write the given Class Intervals.
- In column 2, write the corresponding frequencies denoted by fi
- Calculate and write the Cumulative Frequency (less than type) in column 3, denoted by cf
- Find the total of fi denoted by N, and calculate N/2
- Locate the Cumulative Frequency which is greater than or equal to N/2, and note down its corresponding Median Class
- Calculate Median using following Formula M = L + ( \( \frac{n}{2} \) – cf ) \( \frac{h}{f} \)
Where,
L is Lower limit of Median Class
n is Total frequency
cf is the cumulative frequency of the class preceding the Median Class
f is the frequency of the Median class
h is the width of the Median Class
Median from an Ogive Curve
As we have seen in the Cumulative Frequency topic, the Median of a data can also be calculated by plotting the Less than frequency curve and More than frequency curve. They point at which they intersect, the corresponding value on the X-axis, is the Median of the given data.

Solved Example for You
Q : From the table, find the median class for the following table

Sol : To find the median class, first let us find the total number of frequencies
So here f = 20
Formula to obtain Median Class, is \( \frac{Total number of frequencies + 1}{2} \)
So, Median Class = \( \frac{20+1}{2} \) = 10.5
Hence the Median class of 10.5 lies between the intervals 10.5 – 13.5
Question. How should one calculate the median?
Answer. In order to find the median, the arrangement of the data should take place in order from least to the greatest. In case the number of terms in the data set happens to be even, then one must find the median is found by taking the mean (average) of the two numbers that are the middlemost.
Question. Explain the concept of the median in maths?
Answer. Median is a kind of average in maths. Other important kinds of averages are the mean and mode. Furthermore, median refers to the middle value a particular list of numbers.
Question. What information does the median tell us?
Answer. The median helpful measure of the centre of a dataset. By comparing the median to the mean, one gets an understanding of the dataset distribution. In case the mean and the median are the same, the dataset has a more or less even distribution from the lowest to highest values.
Question. Tell the purpose of finding the median?
Answer. The main purpose of finding the median is the separation of the higher half and the lower half. These halves can belong to various types of data.


Leave a Reply