There are six chocolates lying in the bowl, that you and your 2 friends are eyeing greedily. In the spirit of fairness, all three of you pick up two chocolates each. See what you did here, you calculated the Mean of the data given to you! So let us check out a few concepts and methods of this measure of central tendency…
Videos


Arithmetic Mean
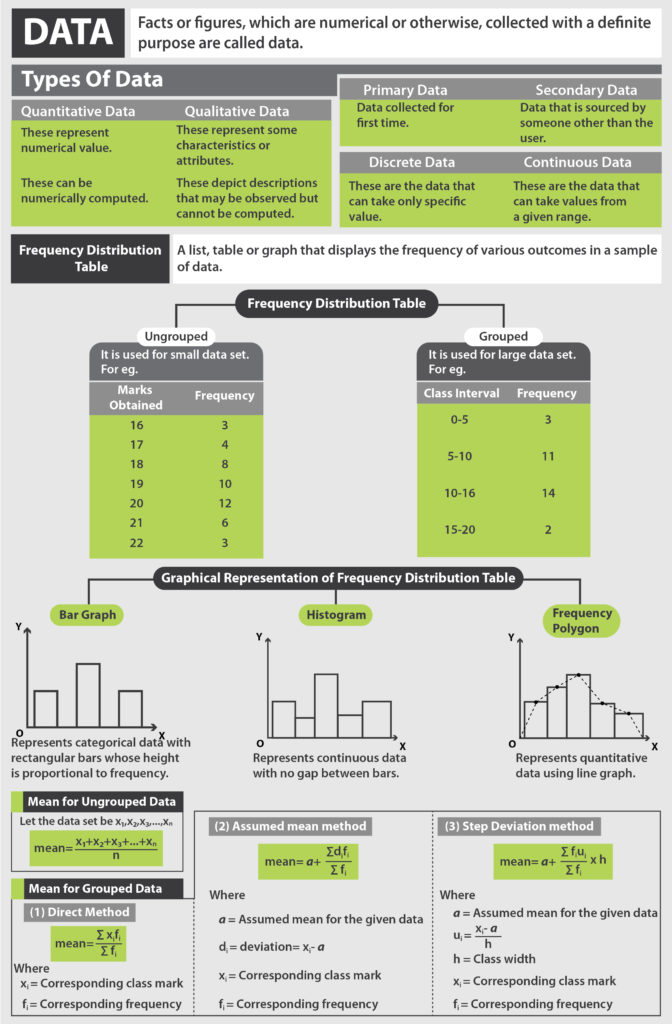
When we are faced with a large set of data, it helps to calculate averages to help make sense of this data. One such average is called the Mean, sometimes also known as the Arithmetic Mean. Mean is the measure of central tendency most commonly used. Mean is equal to the sum of all the values of a collection of data divided by the number of values in the data. In simpler terms, you add up all the values in a data set and divide it by the number of values you added. It can be denoted as follows,
Let the data set be x1, x2, x3……xn
Mean = (x1 + x2……. xn) / n

Example :
Marks obtained by 5 students are 15,18,12,19 and 11
The Arithmetic Mean of marks obtained by students is,
Mean = (x1 + x2……. xn) / n = (15+18+12+19+11) / 5 = 15
Download the Cheat Sheet of Statistics by clicking on the button below

Browse more Topics under Statistics
- Data
- Median
- Mode
- Bar Graphs and Histogram
- Cumulative Frequency Curve
- Frequency Distribution
- Frequency Polygon
- Range and Mean Deviation
- Range and Mean Deviation for Grouped Data
- Range and Mean Deviation for Ungrouped Data
- Variance and Standard Deviation
Mean of Grouped Data
Grouped data is data that has been bundled together for easy understanding. A frequency distribution table is created, which shows the frequencies of the given data set. Let us see the methods of calculating Mean of grouped data.
Direct Method
This is the shortest and simplest method to calculate the arithmetic mean of a grouped data set. The steps are as follows
- Prepare a table containing four columns.
- In column 1 write the class interval.
- In column 2 write the corresponding class marks (midpoint of the class interval) denoted by xi
- In column 3 write the corresponding frequencies (fi) of the class intervals
- In column 4 write the product of column 2 and column 3 which is denoted by xifi
- Calculate Mean by the Formula Mean = ∑xifi / ∑ fi
Assumed Mean Method
Also called the shift of origin method, this method is used when the calculation by the direct method becomes very tedious. Steps to be followed are,
- Prepare a table containing five columns
- Write the class intervals in column 1
- Write the corresponding class marks in column 2, denoted by xi.
- Take the central value from amongst the class marks as the Assumed Mean denoted as A.
- In column 3 calculate the deviations, i.e. di = xi – A
- In column 4 write the frequencies (fi) of the given class intervals
- In column 5 find the mean of di using formula Mean of di = ∑xidi / ∑ di
- To finally to calculate the Mean, we add the assumed mean to the mean of the di
Step deviation method
This is also called the shift of origin and scale method. Steps to be followed are
- Prepare a table containing five columns
- Write the class intervals in column 1
- Write the corresponding class marks in column 2, denoted by xi.
- Take the central value from amongst the class marks as the Assumed Mean denoted as A.
- In column 3 calculate the deviations, i.e. di = xi – A
- In column 4 calculate the values of ui, ui= di/h, where h is the class width.
- In column 5 write the frequencies (fi) of the given class intervals
- Calculate the product of Column 4 and column 5, which is fiui
- Find the Mean of ui = ∑xiui / ∑ ui
- To find the mean we add the assumed mean A to the product of class width (h) with mean of ui
Solved Example for You
Q: The mean of 20 observation is 15. One observation of the 20 is deleted and two more observations are added. However, the mean remains 15, find the sum of the two added observations.
Sol : Mean = (x1 + x2……. xn) / n
Given the Mean of 20 0bservations is 15, thus sum of these observations = 20 x 15 = 300
When 20 is deleted and two more observations are added the sum of observations
= 300 – 20 + X + Y
= 280 + X + Y
The number of observations is now 21, and the mean remains 15
15 = (280 + X + Y) / 21
280 + X + Y = 15 × 21
X + Y = 35
So the sum of the two added observations is 35.
Ques. What is the mean in mathematics?
Ans. In mathematics, the mean is basically the average of a set of some numbers. To find out the mean of a set of some data we have to add up all the numbers in that set, and then we will divide that total by the number of total numbers in that set.
Ques. What is the difference between mean and median?
Ans. The mean is the average and we all know that here we add up all the numbers and then divide by the number of total numbers. The median is the value that lies in the middle of a series. To find out the median the numbers have to be arranged in numerical order from lowest to biggest.
Ques. How to calculate mean?
Ans. The mean is the average of the total numbers. It is very easy to calculate the mean. All we have to do is ‘add up all the numbers and then divide them by total numbers there.
Ques. What is the importance of mean?
Ans. An essential property of the mean is that ‘it includes each and every single value in our data set. Moreover, the mean is the single and only measure for the central tendency. In central tendency, the sum of the deviations of every single value from the mean is always a zero (0).


Leave a Reply