By now we all the concept of frequency of data. But what is the meaning of frequency of a group of data and what is frequency distribution? This lesson simplifies frequency distribution table for both, grouped and ungrouped data using simple examples.
Suggested Videos


Organization of Data
Statistics refers to the collection, organization, distribution, and interpretation of data or a set of observations. It is useful in understanding what a dataset reveals about a particular phenomenon. Trends can be studied and results can be drawn from data interpretation. Hence, statistics is a very useful tool to study data.
Download the Cheat Sheet of Statistics by clicking on the button below

Browse more Topics under Statistics
- Data
- Mean
- Median
- Mode
- Bar Graphs and Histogram
- Cumulative Frequency Curve
- Frequency Polygon
- Range and Mean Deviation
- Range and Mean Deviation for Grouped Data
- Range and Mean Deviation for Ungrouped Data
- Variance and Standard Deviation
Frequency Distribution: Introduction

To understand frequency distribution, let us first start with a simple example. We consider the marks obtained by ten students from a class in a test to be given as follows:
23, 26, 11, 18, 09, 21, 23, 30, 22, 11
This form of data is known as raw data. A statistical measure called range can be defined. It is the difference between the largest and smallest values of a data set. Here, range = 30 – 09 = 21.
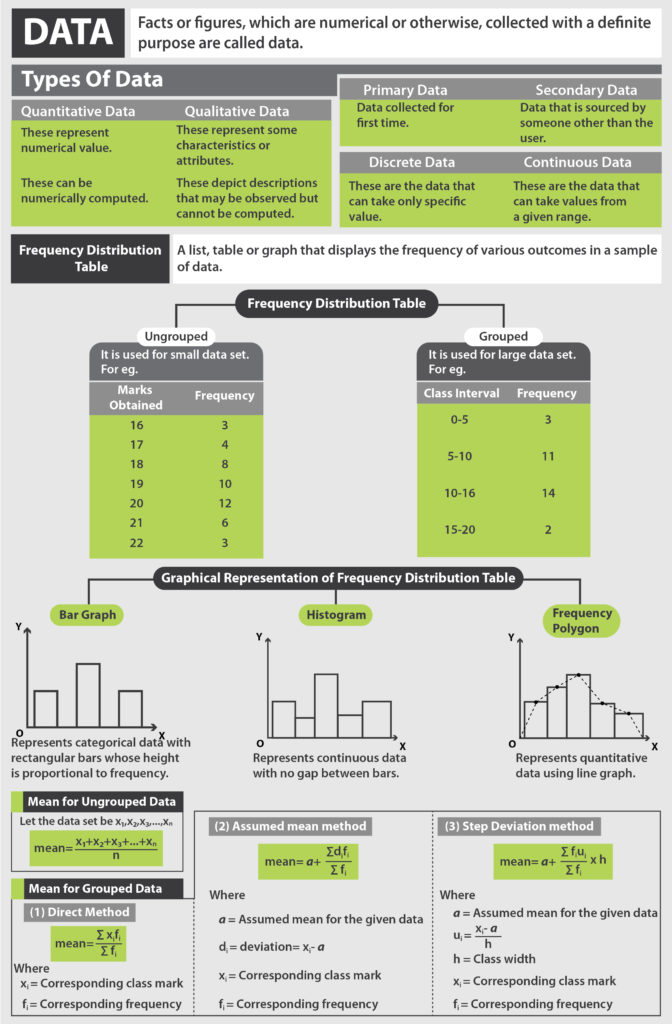
Frequency Distribution Table
Now, imagine how difficult and cumbersome this process would get if there were a larger number of observations. If we were to include the test scores of all 20 students in this class, it would be very difficult to understand and interpret such data unless it is ‘organized’.

The objective of statistical interpretation is to organize data into a concise form so that interpretation and analysis become easy. It is for this reason that we organize larger data into a table called the frequency distribution table.
Ungrouped Data
Let the test scores of all 20 students be as follows:
23, 26, 11, 18, 09, 21, 23, 30, 22, 11, 21, 20, 11, 13, 23, 11, 29, 25, 26, 26
Note that the term frequency refers to the number of times an observation occurs or appears in a data set. Hence, in case of repetitions, the frequency increases. The table below will help you understand this better:
| Marks obtained in the test | No. of students (Frequency) |
| 09 | 1 |
| 11 | 4 |
| 13 | 1 |
| 18 | 1 |
| 20 | 1 |
| 21 | 2 |
| 22 | 1 |
| 23 | 3 |
| 25 | 1 |
| 26 | 3 |
| 29 | 1 |
| 30 | 1 |
| Total | 20 |
In the example above, the frequency refers to the number of students getting a particular mark in the test. Also, note that your frequency must always total the number of observations after tallying. Here, the total we have obtained after tallying the test scores of the students is 20 which is also the number of observations given.
Read more about Bar Graphs and Histograms here in detail.
A frequency distribution such as the one above is called an ungrouped frequency distribution table. It takes into account ungrouped data and calculates the frequency for each observation singularly.
Grouped Data
Now consider the situation where we want to collect data on the test scores of five such classes i.e. of 100 students. It becomes difficult to tally for each and every score of all 100 students. Besides, the table we will obtain will be very large in length and not understandable at once. In this case, we use what is called a grouped frequency distribution table.
Learn more about Range and Mean for Grouped Data here in detail.
Such tables take into consideration groups of data in the form of class intervals to tally the frequency for the data that belongs to that particular class interval.
Take a look at the table below to understand the concept better:
| Marks obtained in the test (Class Interval) | No. of students (Frequency) |
| 0-5 | 3 |
| 5-10 | 11 |
| 10-15 | 38 |
| 15-20 | 34 |
| 20-25 | 9 |
| 25-30 | 5 |
| Total | 100 |
The first column here represents the marks obtained in class interval form. The lowest number in a class interval is called the lower limit and the highest number is called the upper limit. This example is a case of continuous class intervals as the upper limit of one class is the lower limit of the following class.
Note that in continuous cases, any observation corresponding to the extreme values of a class is always included in that class where it is the lower limit. For example, if we had a student who has scored 5 marks in the test, his marks would be included in the class interval 5-10 and not 0-5.
Analogous to continuous class intervals are disjoint class intervals. An example of such as case would be 0-4, 5-9, 10-14, and so on. The frequency distribution can be done for disjoint data as well, similar to how it is done above.
Solved Example for You
Question 1: The following is the distribution for the age of the students in a school:
| Age | 0-5 | 5-10 | 10-15 | 15-20 |
| No. of Students | 35 | 45 | 50 | 30 |
Calculate:
- The lower limit of the first class interval.
- The class limits of the third class.
- The classmark for the interval 5-10.
- The class size.
Answer:
- The lower limit of the first class interval i.e. 0-5 is ‘0’.
- The class limits of the third class, i.e. 10-15 are 10 (lower limit) and 15 (upper limit).
- The classmark is defined as the average of the upper and lower limits of a class. For 5-10, the classmark is (5+10)/2 = 7.5
- The class size is the difference between the lower and upper class-limits. Here, we have a uniform class size, which is equal to 5 (5 – 0, 10 – 5, 15 – 10, 20 – 15 are all equal to 5).
Question 2: Discuss the differences between the frequency table and the frequency distribution table?
Answer: The frequency table is said to be a tabular method where each part of the data is assigned to its corresponding frequency. Whereas, a frequency distribution is generally the graphical representation of the frequency table.
Question 3: What are the numerous types of frequency distributions?
Answer: Different types of frequency distributions are as follows:
- Grouped frequency distribution.
- Ungrouped frequency distribution.
- Cumulative frequency distribution.
- Relative frequency distribution.
- Relative cumulative frequency distribution, etc.
Question 4: What are some characteristics of the frequency distribution?
Answer: Some major characteristics of the frequency distribution are given as follows:
- Measures of central tendency and location i.e. mean, median, and mode.
- Measures of dispersion i.e. range, variance, and the standard deviation.
- The extent of the symmetry or asymmetry i.e. skewness.
- The flatness or the peakedness i.e. kurtosis.
Question 5: What is the importance of frequency distribution?
Answer: The value of the frequency distributions in statistics is excessive. A well-formed frequency distribution creates the possibility of a detailed analysis of the structure of the population. So, the groups where the population breaks down are determinable.


Leave a Reply